Unlocking the Power of Pandas: Simplifying Data Analysis with Mito
Written on
Chapter 1: Introduction to Mito and Pandas
Pandas is an essential library for data scientists, widely employed for tasks such as data cleansing, manipulation, and visualization. As someone who has extensively used Pandas, I've recognized certain methods that are frequently utilized in various projects. While these methods are crucial for working with dataframes, they can become monotonous over time, and their syntax can sometimes slip your mind.
In this article, I'll demonstrate how to simplify six commonly used Pandas methods through a library called Mito. Mito allows users to interact with a Pandas dataframe in a manner similar to Excel, enhancing the ease of use.
First Things First — Installing Mito
To effectively simplify the six methods we’ll discuss, you need to install Mito first. Open a terminal or command prompt and execute the following commands (it's best to use a new virtual environment):
python -m pip install mitoinstaller
python -m mitoinstaller install
Ensure that you have Python 3.6 or higher and JupyterLab installed for Mito to function correctly. After installation, restart the JupyterLab kernel and refresh your browser to begin using Mito. For further information, refer to their GitHub and documentation.
Section 1.1: Utilizing read_csv
The read_csv function is arguably the most utilized method in Pandas, serving as the starting point for any data science project by allowing users to create a dataframe from a CSV file. With Mito, importing a CSV file can be done with just a few clicks. Simply import mitosheet and create a sheet:
import mitosheet
mitosheet.sheet()
Once you run this code, a purple sheet will appear, and you can click the “Import” button to upload any dataset from your working directory.
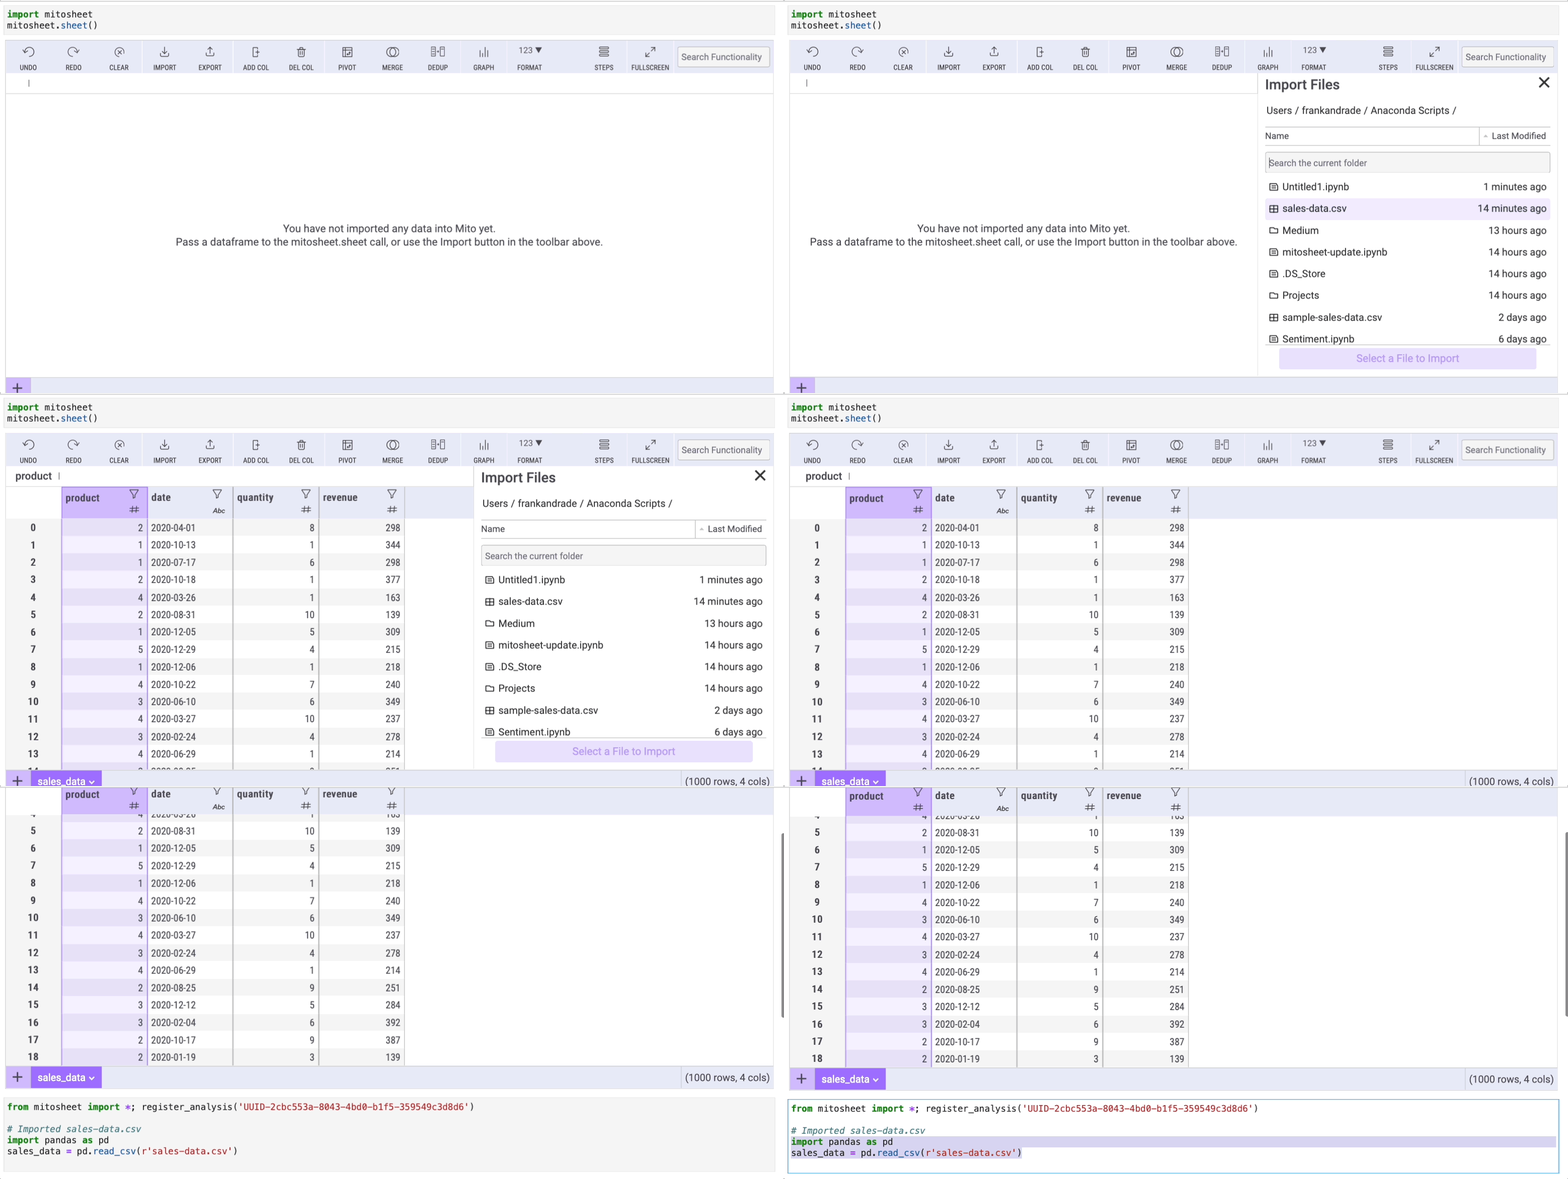
In this example, I imported a dataset called ‘sales-data.csv,’ which I created for demonstration purposes and is available on my Google Drive. Mito will also generate the corresponding Python code used for this import.
Section 1.2: Leveraging value_counts
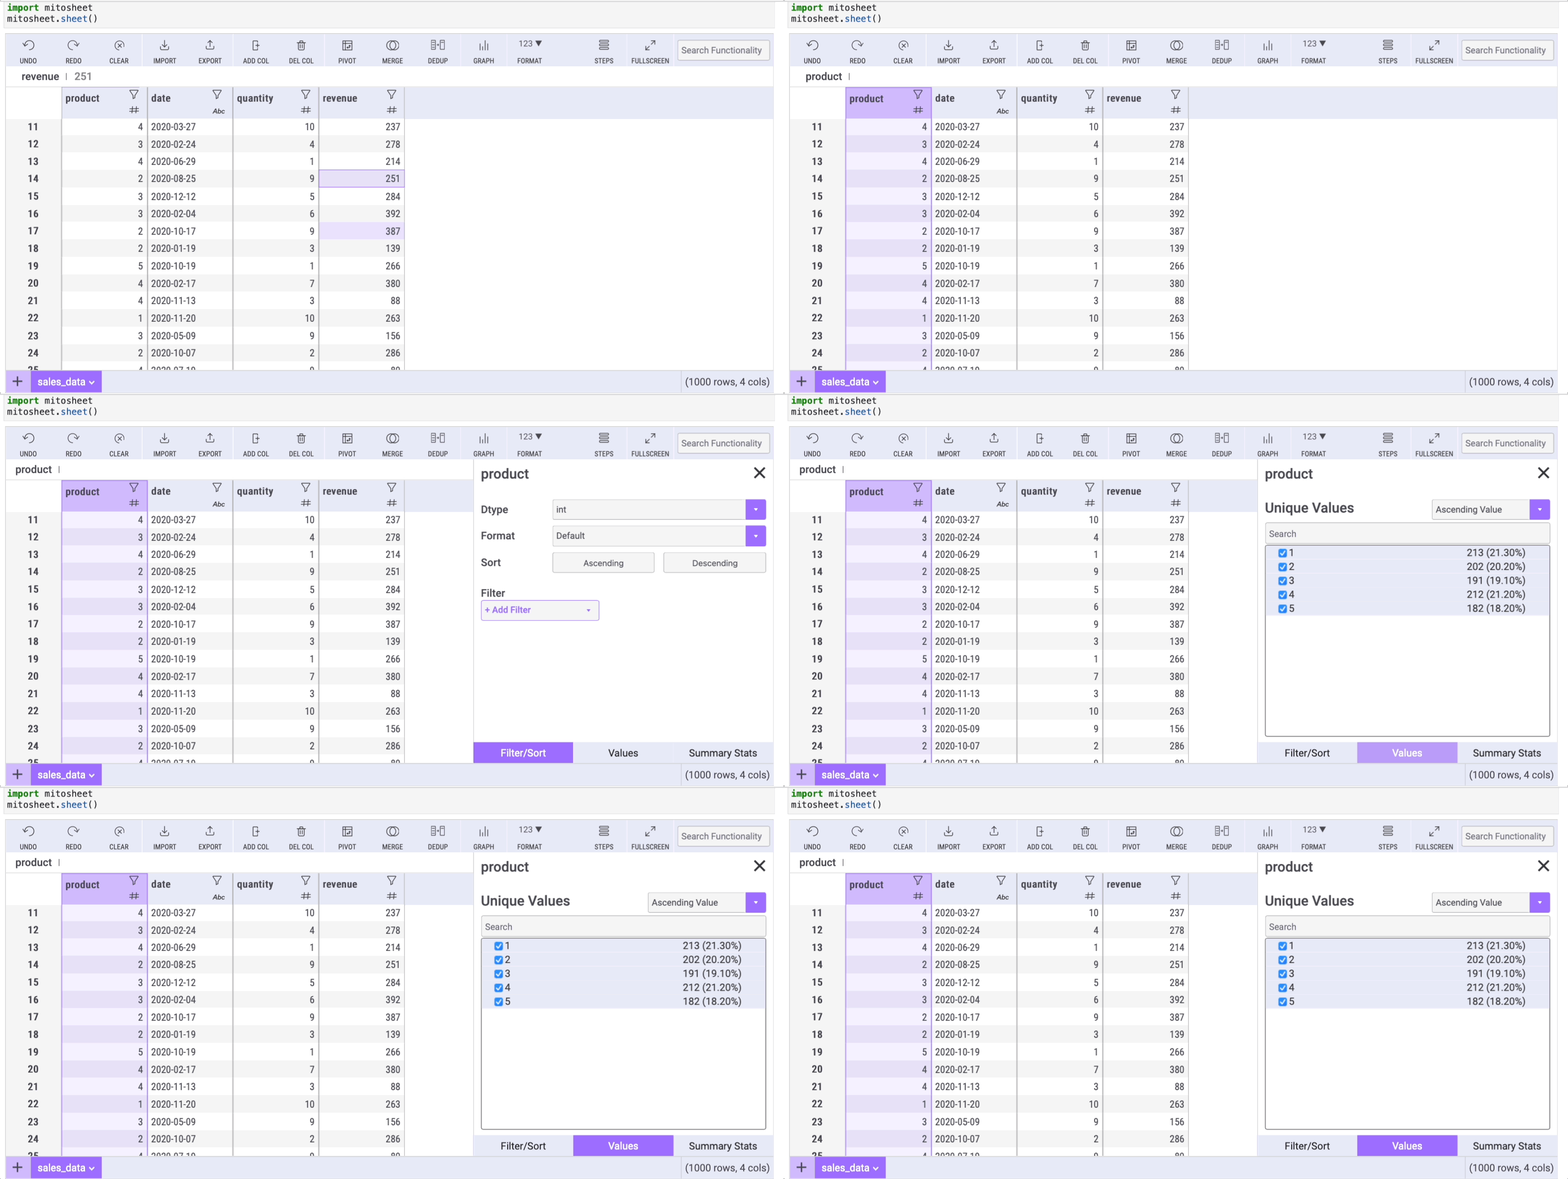
Another frequently used method is value_counts, which counts the unique values within a column. This functionality can also be accessed effortlessly using Mito. To count unique elements in the “product” column, simply select the column and click the filter button:

A window will appear with three tabs, each designed to help replace common Pandas methods. Select the “Values” tab to view counts and percentages of unique values.
Section 1.3: Changing Data Types with astype
How often have you needed to alter a column's data type using the astype method? Mito simplifies this process too! It displays the data type of each column using icons next to their names. For instance, if you want to change the data type of the “date” column from string to date, click the filter icon, select the “Filter/Sort” tab, and choose the desired data type from the “Dtype” dropdown.
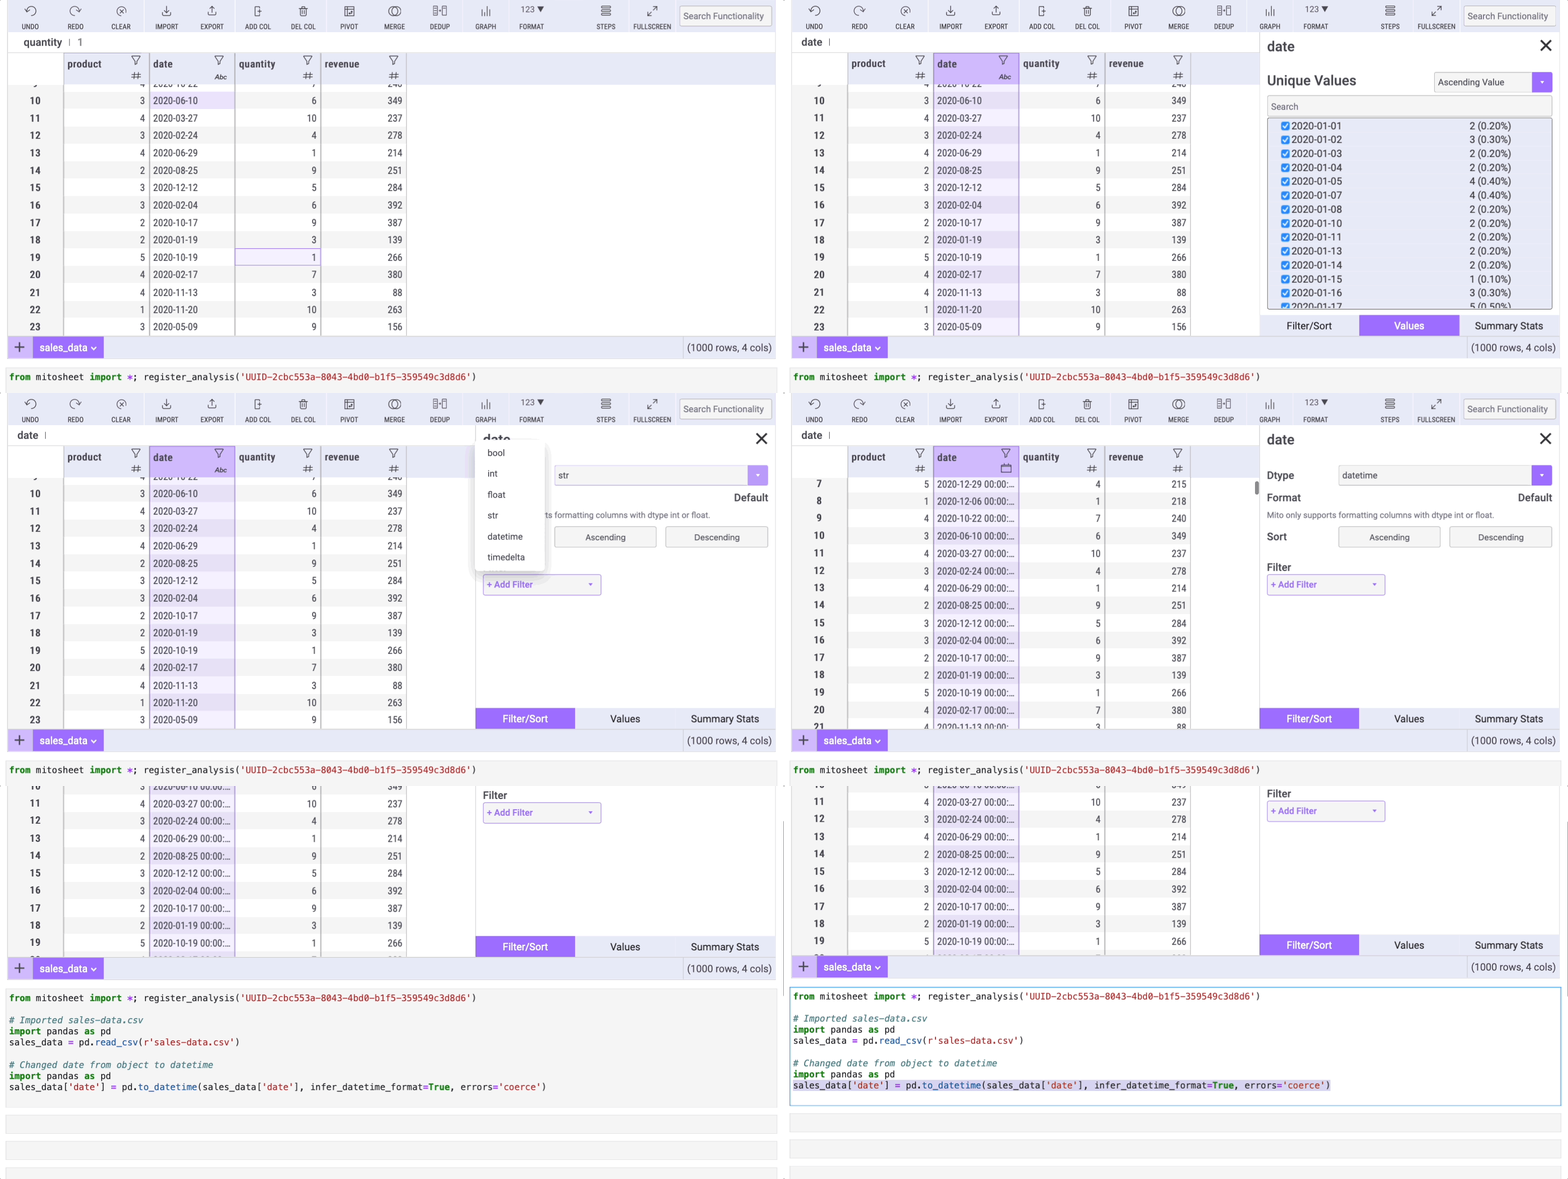
Mito will automatically generate the corresponding code for this action.
Chapter 2: Exploring Additional Methods
The first video discusses how to quickly analyze data in Python using Mito, providing a visual guide to the functionalities we've covered.
The second video focuses on a Python package that accelerates data science by tenfold, enhancing your programming experience.
Section 2.1: Summary Statistics with describe
The describe method is indispensable in data analysis, offering basic statistics such as mean, median, and mode. In Mito, it's simple to access these statistics; just click on the filter icon of any column and select the “Summary stats” tab.
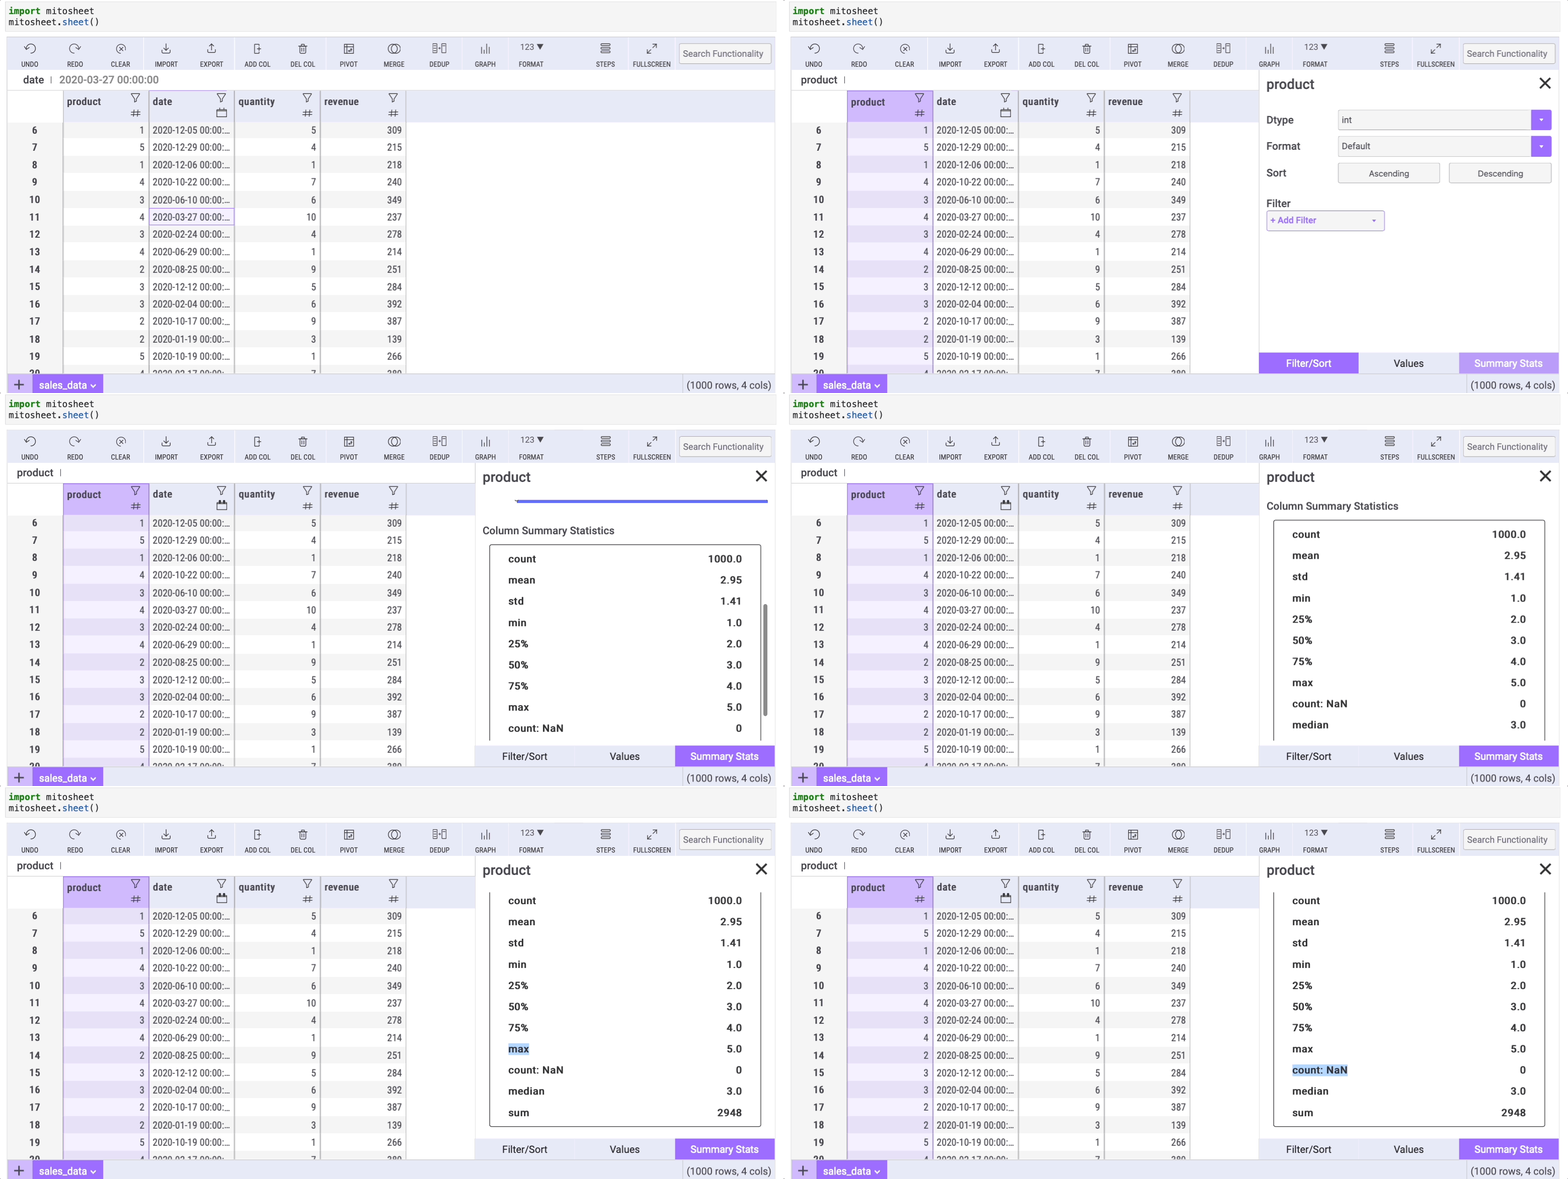
Mito’s summary also includes a “count: NaN” row, indicating the number of missing values within a column.
Section 2.2: Handling Missing Data with fillna
Dealing with missing data is a common challenge in real-world datasets. The fillna method in Pandas addresses this issue, and Mito offers a straightforward approach to fill in missing values. First, create a new column by clicking the “Add Col” button. Then, within any cell of the new column, input the formula:
=FILLNAN(series, 'text-to-replace')
Here, series refers to the column with missing data (in this example, I've removed some values from the “revenue” column to create NaN entries).
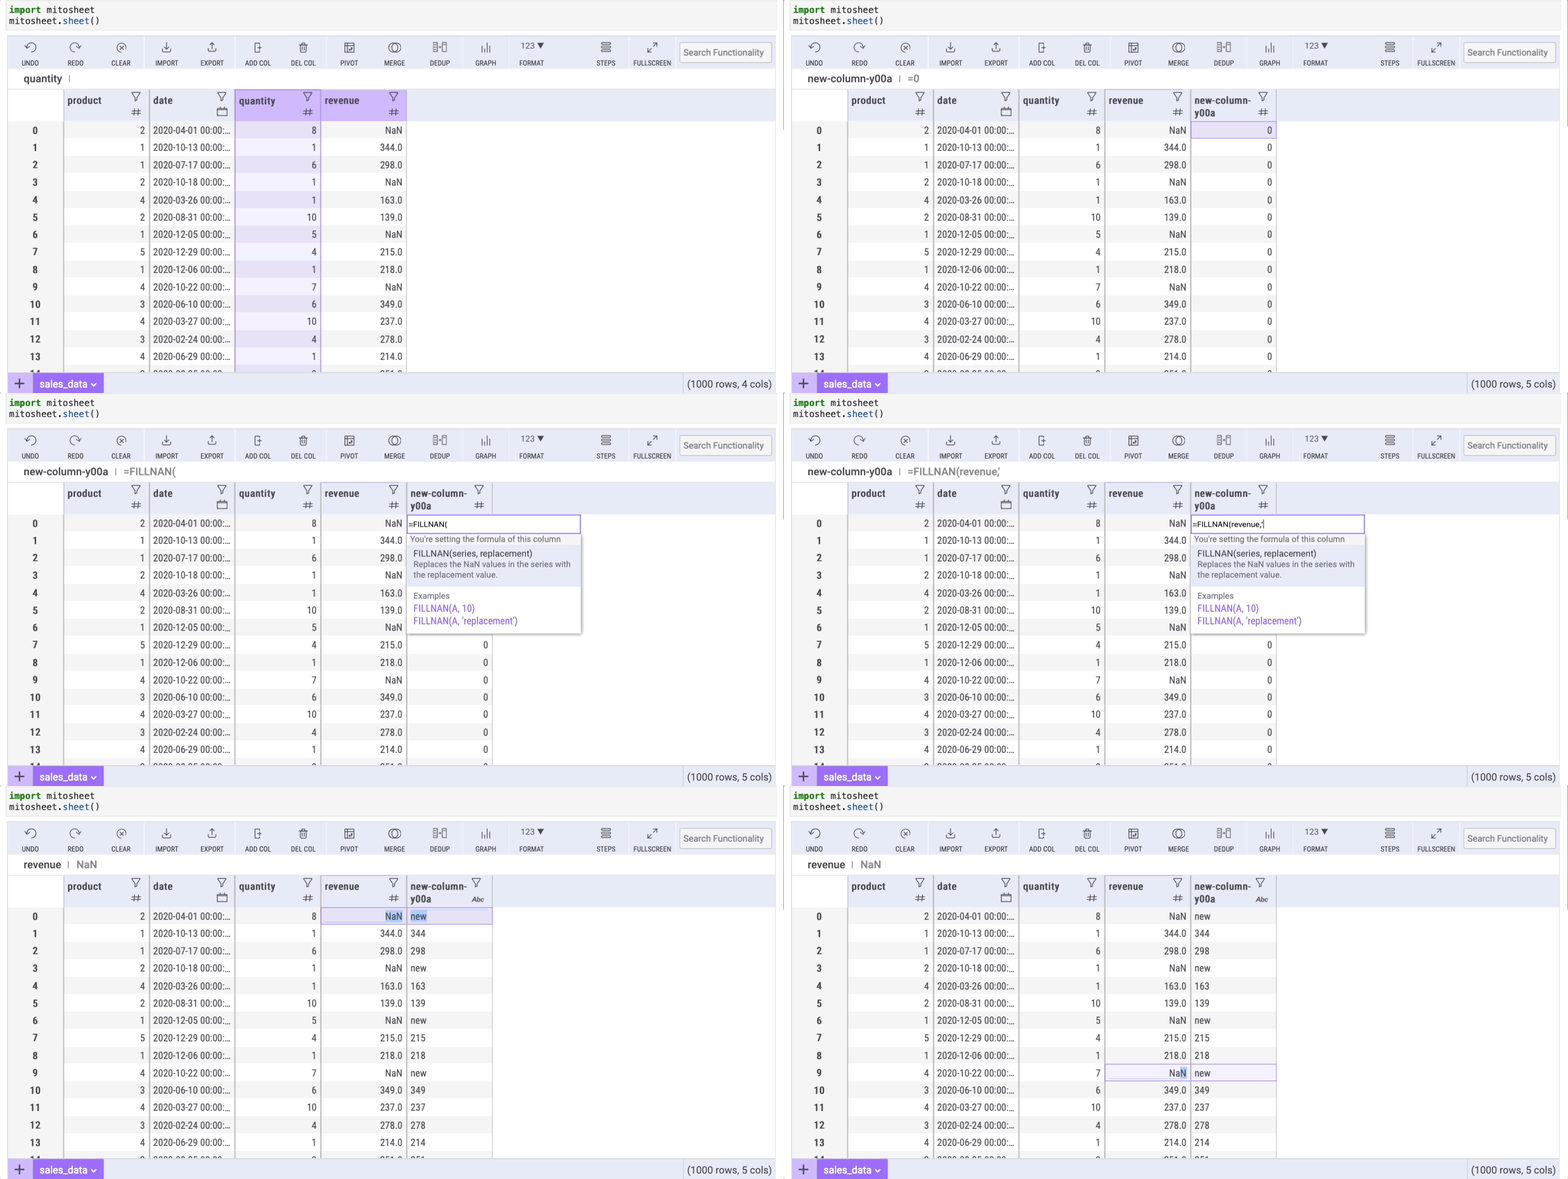
After pressing enter, all cells will auto-fill with the specified formula, populating the NaN cells accordingly.
Section 2.3: Aggregating Data with groupby
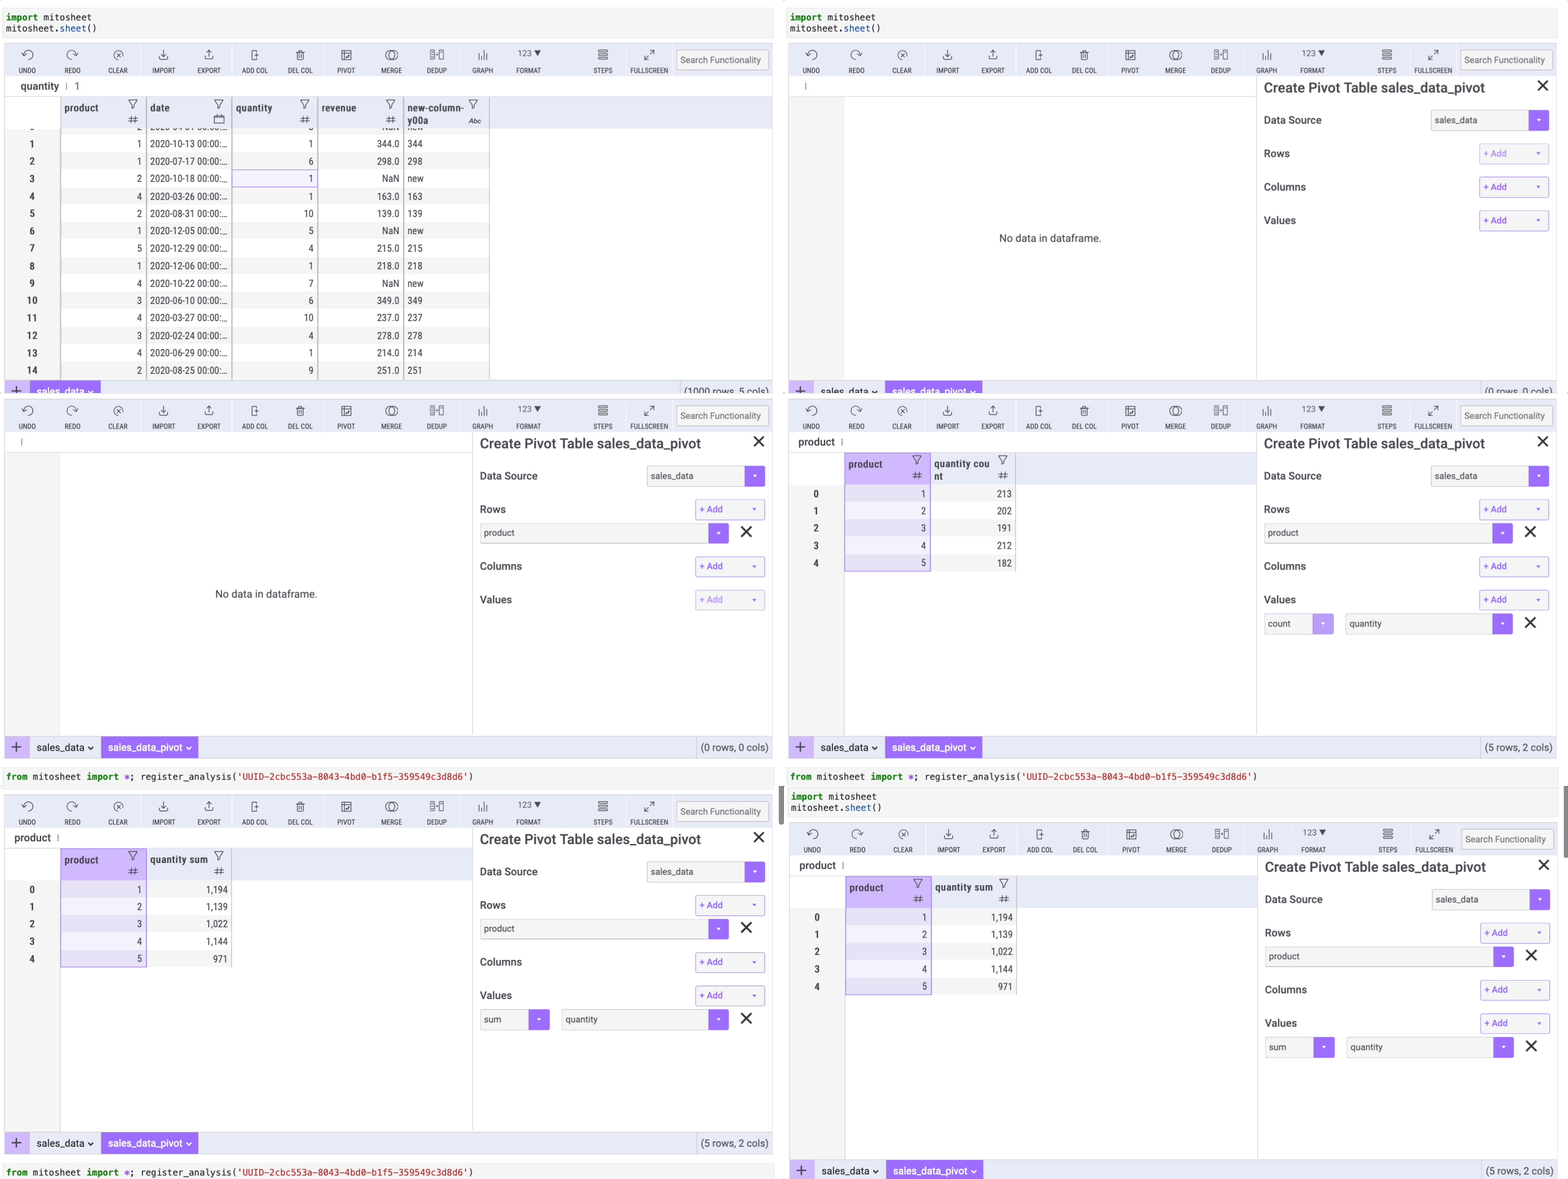
The groupby method is essential for aggregating data to perform operations like counting or summing. While Mito doesn't directly replace groupby, you can achieve similar results through the “Pivot” option. Select the rows/columns and the data you wish to display. For instance, to group data by product and sum the quantities for each group, follow the outlined steps.
Join my email list of over 10,000 subscribers to receive my free Python for Data Science Cheat Sheet, which I utilize in all my tutorials!