Understanding the Actual COVID-19 Infection Rates: A Deep Dive
Written on
Chapter 1: The Challenge of Estimating COVID-19 Cases
Determining the total number of COVID-19 infections has proven to be one of the most frustrating aspects of the pandemic.

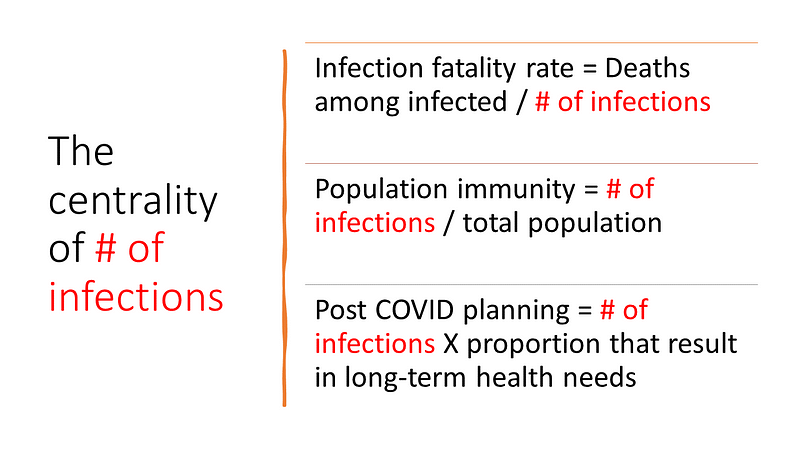
This figure is crucial for a multitude of reasons. It serves as the denominator for calculating the infection fatality rate — providing insight into how severe this virus is compared to others. Additionally, it indicates the percentage of the population that may have developed significant immunity, which can influence vaccination strategies aimed at achieving herd immunity. Understanding this number is also vital for future healthcare planning, especially since individuals who have contracted the virus may face ongoing health issues long after the pandemic has ended.
However, accurately tracking the total number of COVID infections has been complicated due to the virus's ability to infect individuals with mild or no symptoms. This issue is exacerbated by the initial lack of access to testing and the ongoing reluctance to seek tests, particularly given that those who test positive must quarantine without guaranteed income support — a situation that fosters underreporting.

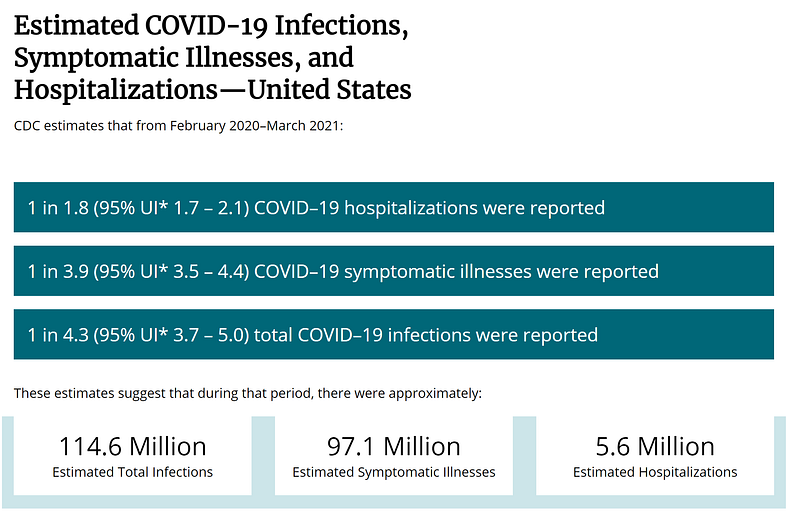
The CDC has made several attempts to estimate the true cumulative incidence of SARS-CoV-2 infections in the United States. As of April 2021, the CDC reported approximately 114 million infections, with about a quarter identified through testing. However, the CDC's methodology has its drawbacks, including some questionable assumptions about the likelihood of infected individuals seeking medical care.
A new analysis by Adrian Raftery and Nicholas Irons, published in the Proceedings of the National Academy of Sciences, utilizes various data sources — including reported case rates, mortality rates, and testing rates — which fluctuate over time and across regions to provide a more accurate estimate of infections.

Before delving deeper, it’s essential to consider a straightforward approach to estimating infections: random sampling of the population for coronavirus antibodies. This method is routinely used for other health metrics, such as determining average cholesterol levels in Americans.
Yet, only two states, Indiana and Ohio, have conducted systematic random sampling to ascertain the number of infections. Raftery and Irons base their statistical model on the data from these states to extrapolate findings for the rest of the country. Their analysis indicates that between March 2020 and March 2021, approximately 65 million people — around 20% of the U.S. population — contracted the coronavirus. This figure is significantly lower than the CDC's estimates for the same period.
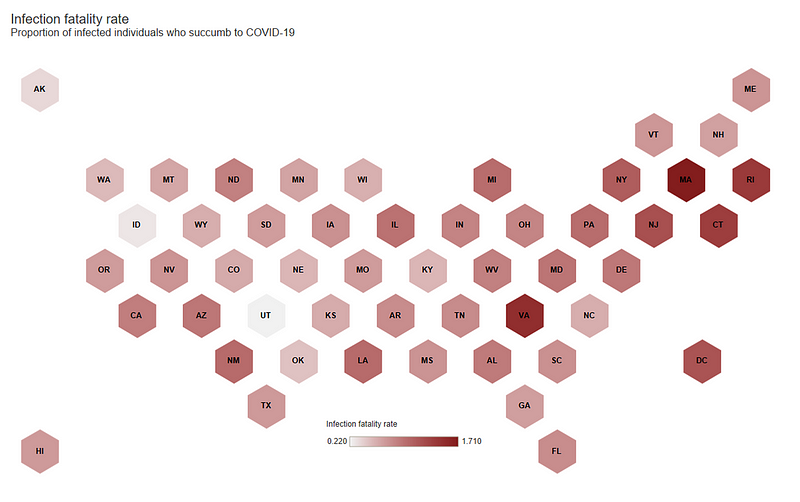
The implications of this data are substantial. While the CDC suggests an infection fatality rate of 0.5%, which is distinct from the case fatality rate (the death rate among confirmed cases), the data from Raftery indicates a higher infection fatality rate of about 0.8 to 0.9%. This rate varies by state, with estimates ranging from a low of 0.2% in Utah to a high of 1.7% in Massachusetts.

How do we know that this model is more accurate than previous ones? The authors have shared projections based on their data, which has been validated against real-world outcomes up to March 2021.

While their projections align well with recorded data, they do not account for the surge in infections caused by the delta variant. This discrepancy could stem from assumptions in their model, particularly the notion that individuals previously infected cannot contract the virus again.
The authors also integrated vaccination data into their overall infection model to determine the percentage of Americans who would achieve immunity. They estimate that by August, approximately 70% of the population could be immune, primarily through vaccination efforts. However, achieving herd immunity against the delta variant may require 75-80% immunity, suggesting that the path ahead remains challenging. The authors' assumptions, which include a daily vaccination rate of 2 million individuals, may be overly ambitious, as the current rate is around 500,000 shots per day.
In summary, this model paints a somewhat disheartening picture: the coronavirus is likely deadlier than previously believed, and the goal of herd immunity appears more distant. If these findings hold true, we may face significant challenges in the coming months.
Chapter 2: Current COVID-19 Trends and Updates
The first video titled "How Many People REALLY Had COVID-19?" provides insights into the pandemic's infection statistics and the implications for public health policy.
The second video, "Is COVID on the rise again? The latest COVID news, FLiRT variant symptoms and bird flu outbreak 2024," discusses the recent trends and developments in COVID-19 cases.