Mastering Your SIEM Home Lab: A Step-by-Step Guide
Written on
Chapter 1: Introduction to the SIEM Lab
In this segment of our ongoing series about constructing a Security Information and Event Management (SIEM) lab, we will focus on enhancing our 'Purple Team' capabilities. The term 'Purple Team' signifies that while we will prioritize 'Blue Team' operations, we must also incorporate 'Red Team' methodologies to generate pertinent data for our SIEM. This series will unfold in the following sections:
- Establishing the lab
- Logging activities and data ingestion
- Utilizing Elastic Agent for investigations
- Analyzing data with Winlogbeat
In the initial part, we configured the SIEM using the Elastic Stack. If you're not acquainted with Elastic or wish to follow my steps precisely, I recommend reviewing that section first.
The second part emphasized configuring the appropriate event logging in our lab and setting up Elastic agents to gather and send these logs to our SIEM.
In this third part, we will simulate "malicious activities" using the Atomic Red Team framework and examine them within the SIEM.
Kibana Overview
Before diving in, let’s briefly revisit the Kibana dashboard and highlight the key features we will utilize. As of version 7.10, Kibana consists of five major sections; however, we will focus on two: Kibana itself and the Security section.
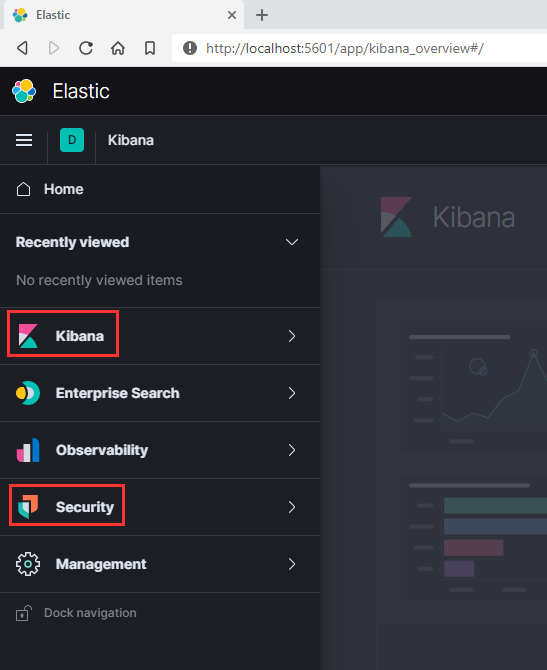
I will guide you through some essential functionalities, but I strongly encourage you to refer to Kibana’s official documentation for a more in-depth understanding.
Discover Feature
Let’s expand the Kibana section and select ‘Discover.’
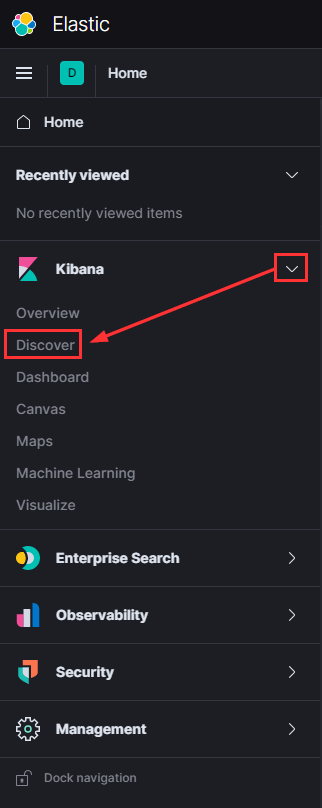
This feature serves as a versatile tool for querying all data compiled in your Elastic Stack. For an exhaustive explanation, you can consult the Discover documentation, but I’d like to highlight a few functionalities we will employ.
It’s important to know that all data entering Elastic is indexed based on various customizable criteria. The default setup follows a pattern similar to “<source-agent><agent-version><timestamp>.”
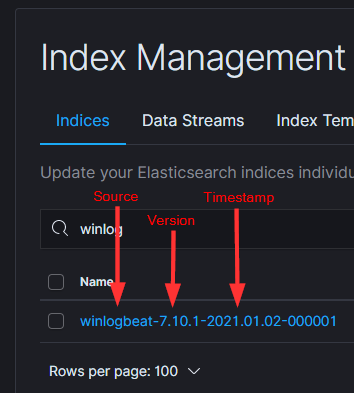
For instance, if you have several days of Winlogbeat data:
- winlogbeat-7.10.1–2021.01.02
- winlogbeat-7.10.1–2021.01.03
- winlogbeat-7.10.1–2021.01.04
These entries are logically grouped into an index pattern for use in Kibana:
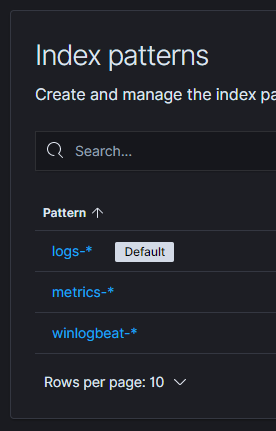
You can see that each entry corresponds to a specific index type, concluding with a wildcard (*) that encompasses all indexes of that type. This structure facilitates easy filtering of different index types in Kibana Discover:
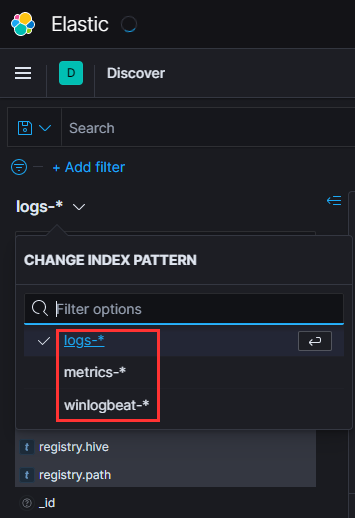
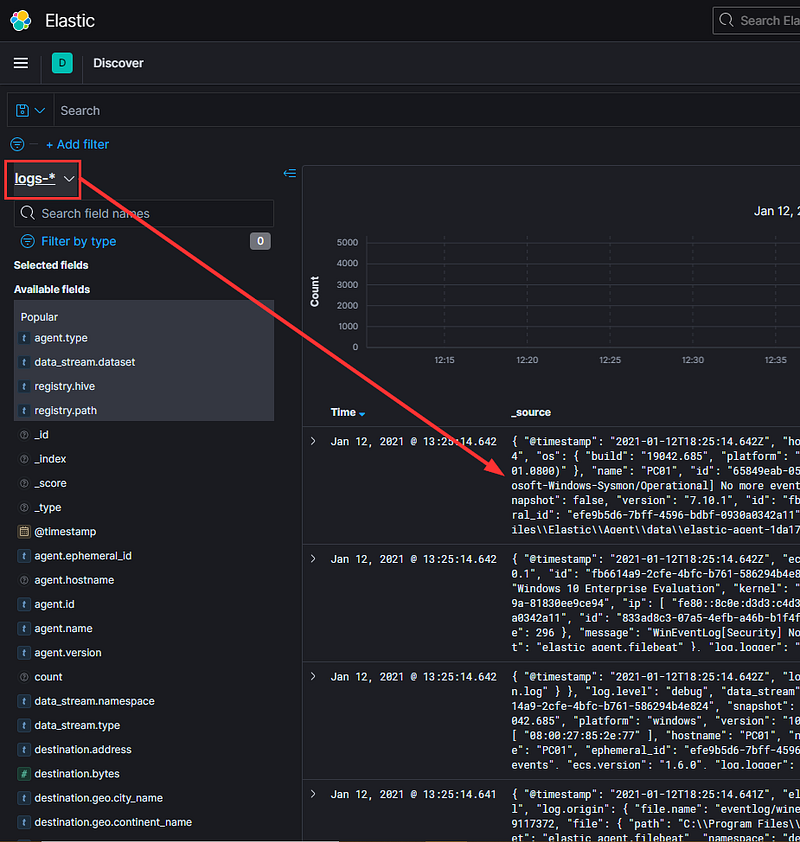
Now, we can conveniently filter logs from the Elastic Agent on our test PC…
…as opposed to logs from the Winlogbeat agent on our Active Directory server.
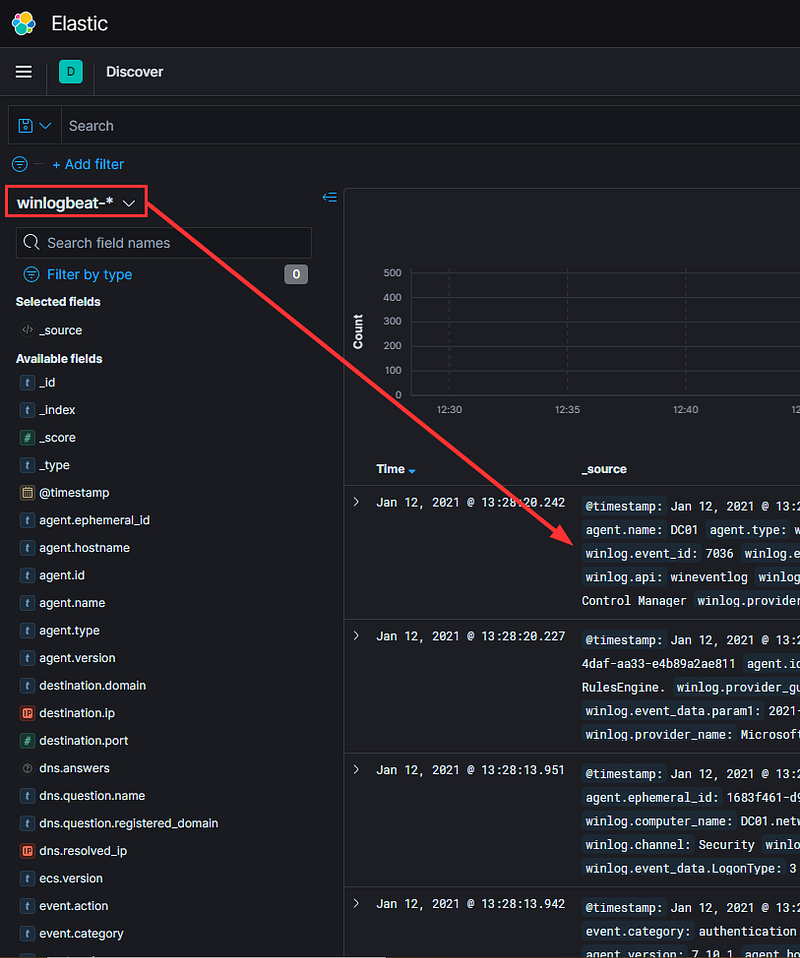
When we reach the exploitation section of this guide, I will demonstrate effective methods for parsing the logs to simplify analysis. For now, remember that the Discover page is your go-to location for accessing all logs in the system.
Security Overview
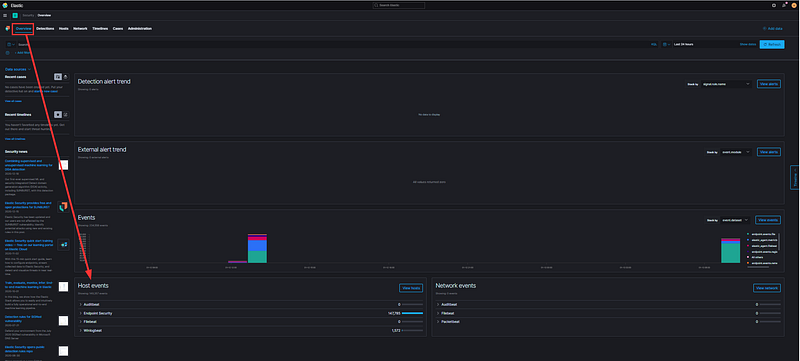
Next, let’s focus on the Overview tab within the Security section.
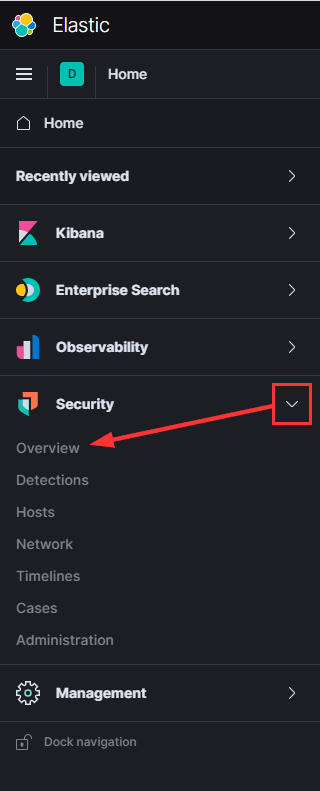
This area is packed with useful features, and Elastic is continuously enhancing their security solutions; for detailed insights, refer to their Security documentation. The Overview page provides a snapshot of all security-related activities within your Elastic Stack.
One important feature to explore is the Host Events section located at the bottom of the page.
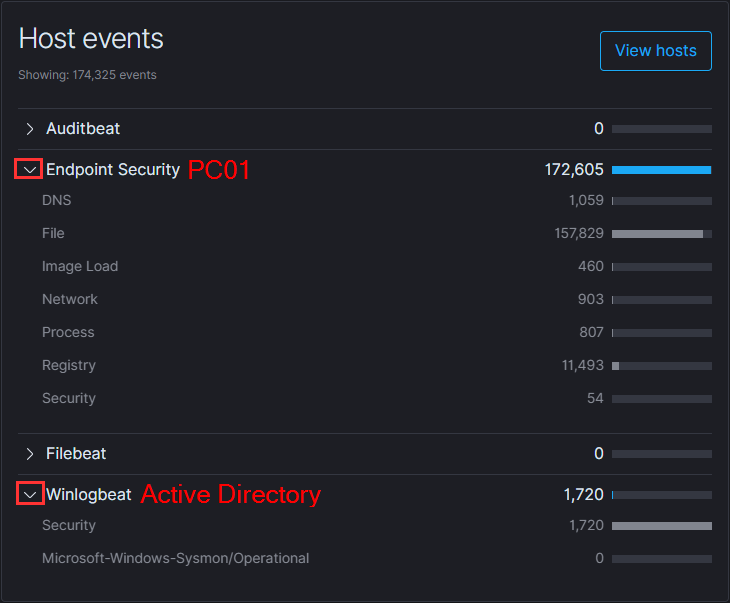
Expanding the dropdown for both Elastic Security and Winlogbeat reveals a more detailed breakdown of the source data collected by Elastic Security from each agent. Here, you can see what types of data are being ingested from the agents installed on your test workstation and domain controller.
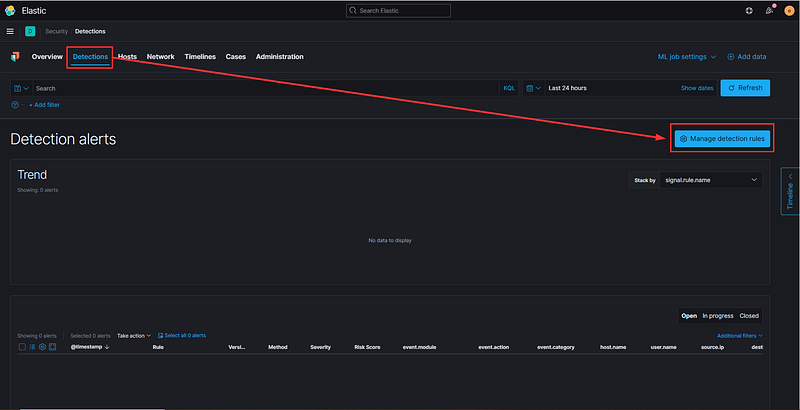
Next, let’s navigate to the Detections page. Since this is a fresh Elastic Stack installation, there may not be much data present initially. You can enhance this by selecting "Manage detection rules" on the far right.
Then, click the button labeled “Load Elastic prebuilt rules and timeline templates.”
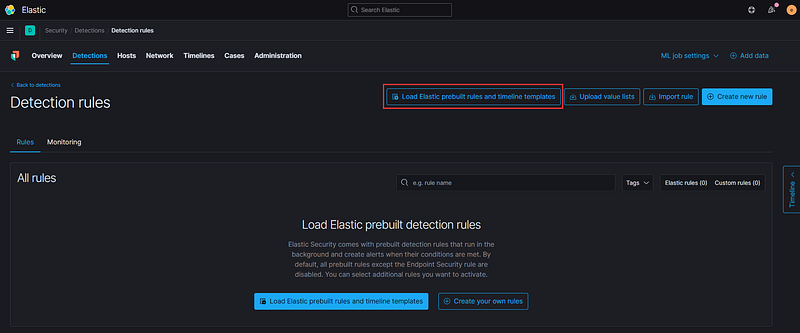
This process may take a few minutes to complete initially, but once finished, you should see a list of 316 (as of this writing) pre-defined detections created by Elastic. These detections are designed to identify suspicious activity in your environment, which is crucial for any SOC Analyst.
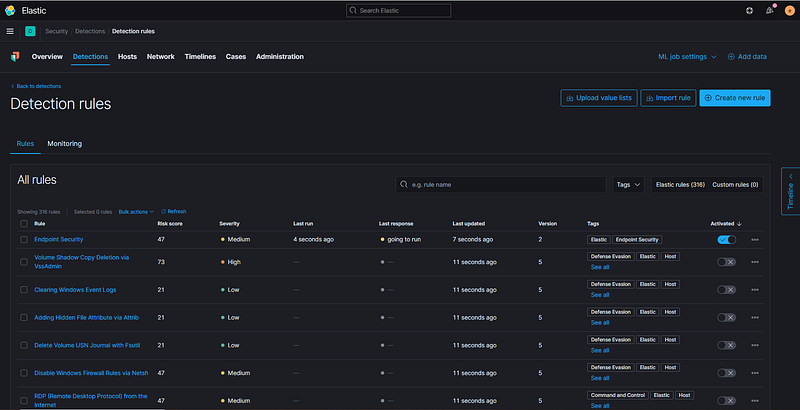
In addition to the built-in detections, you can also create custom rules by selecting “Create new rule” on the right. This feature is a significant advantage of using Elastic SIEM, and we will delve deeper into custom rules as we start testing systems in our lab.

Command Line Audit Logging
Before we proceed, there's one last configuration to implement that I neglected to cover in part two, which is command line audit logging. Essentially, we want logs to capture the commands executed in both the Windows command line and PowerShell. This is a valuable feature in your production environment and aligns with CIS 20 security control number 8.8.
First, ensure that your advanced audit settings include Detailed Tracking -> Audit Process Creation.
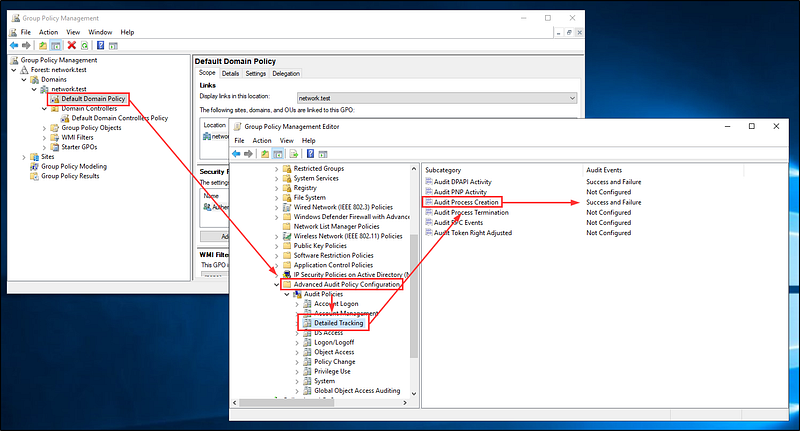
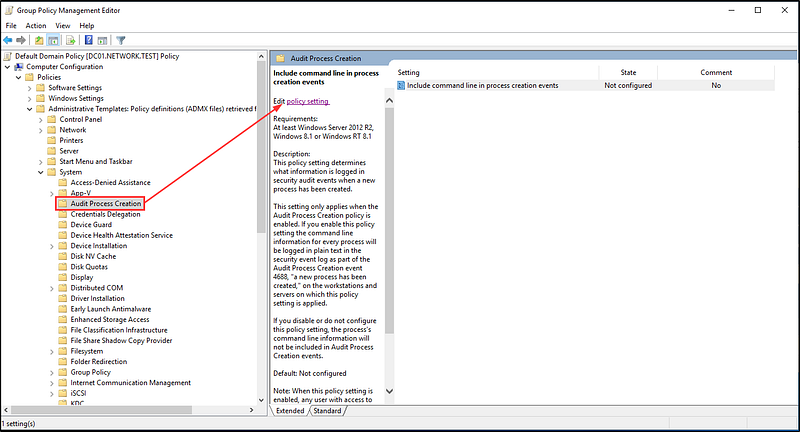
Next, use Group Policy to enable command line logging for both your default domain policy and your default domain controller policy.
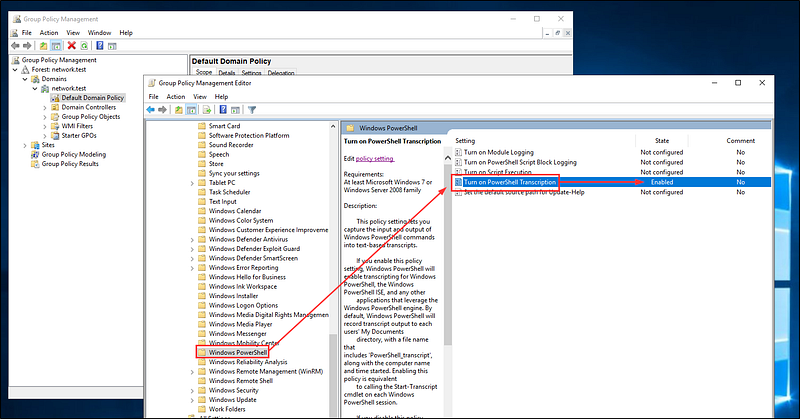
Ensure that you also enable logging for PowerShell:
Computer Configuration -> Administrative Templates -> Windows Components -> Windows PowerShell
Automated Testing
Having reviewed the SIEM's user interface and its functionalities, we can start our training to identify potentially malicious traffic. In this guide, we will focus on a tool called Atomic Red Team. If you’re unfamiliar, think of it as a suite of scripts designed to emulate malicious techniques documented in the Mitre ATT&CK Framework.
I should mention that you can utilize this tool to assess the effectiveness of various products beyond Elastic. You can run these tests against platforms like Splunk, Crowdstrike, and Cylance to see how they respond.
Below is a playlist featuring short tutorials on how to set up Atomic Red Team in your lab (I will only be installing it on the Windows workstation for now).
This playlist includes a library of brief tutorial videos showcasing the many features of Invoke-Atomic and Atomic Red Team.
If you're interested in a more in-depth exploration, I highly recommend this video from a class presented at Defcon 2020.
Atomic Red Team is an open-source initiative designed to help you evaluate, monitor, and enhance your security measures by executing straightforward “atomic tests” that are mapped to the Mitre ATT&CK framework.
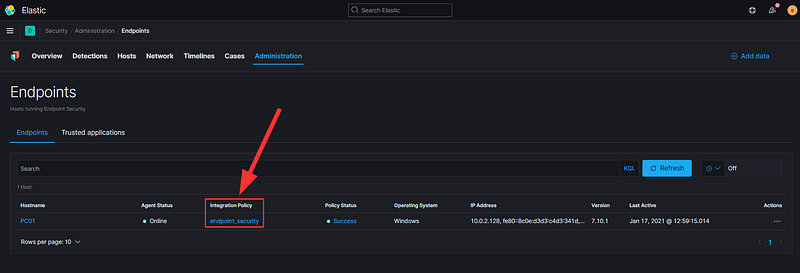
Once we finish installing Atomic Red Team, we can begin our testing. I have set the Elastic Agent to 'detect' mode, configured in Security -> Administration -> Integration Policy.
Credential Dumping
One tactic an attacker may employ after gaining access to a host and escalating privileges is to extract user credentials stored in memory. There are several methods to achieve this, but we will focus on testing it via the SAM database.
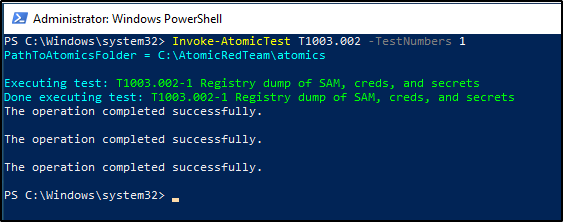
The Atomic test for this is T1003.002 #1, but first, let’s verify that we meet all prerequisites.

Next, we will execute the test from a PowerShell terminal running as Administrator.

Now that we have completed the action, how do we find it in Elastic? A quick glance at the Discover tab shows that over 345k logs have been ingested since I powered up my lab.

There isn't a singular best method for detecting malicious activities, and everyone has their own approach. This scenario is somewhat contrived since we already know what occurred, but let’s assume we don’t know the specifics, only the approximate time frame.
The first step is to search based on timestamps. I prefer to select the first log I see, filter by timestamp, and then adjust the range.
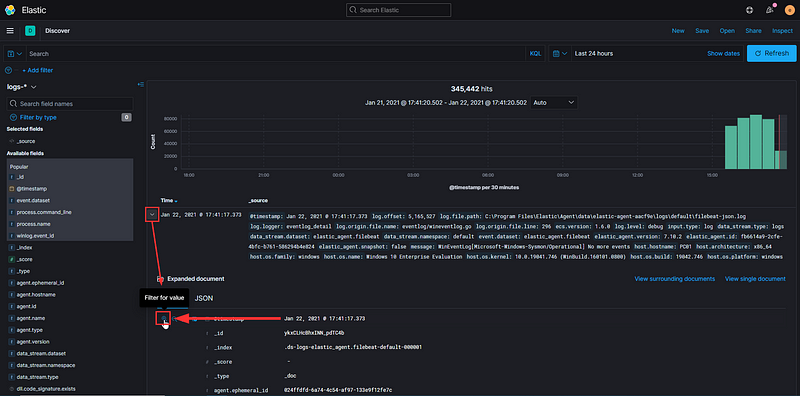
Click on the filter, then edit it…
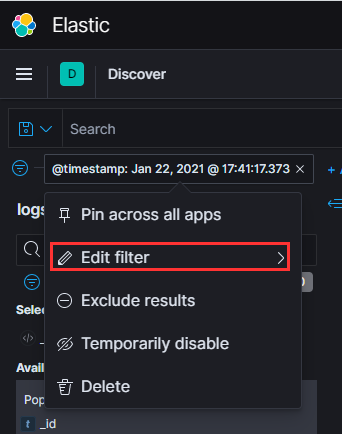
…change the setting to be a range…
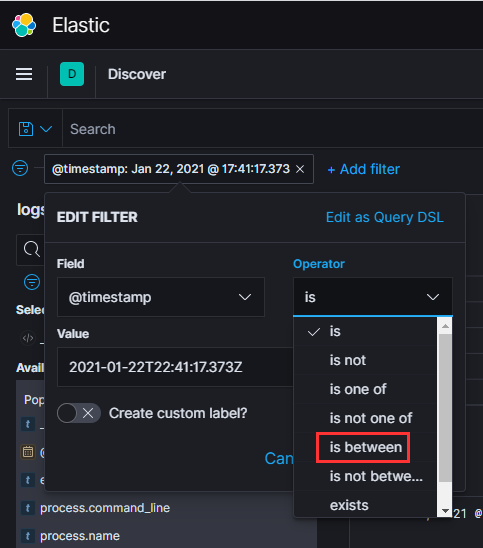
…and give ourselves a 30-second window. Now, the number of events has significantly decreased from 345k to just over 1k.

While this is an improvement, we still have a considerable number of logs to analyze. We can refine our filters further. In the previous segment, we activated Audit Process Logging in our Group Policy settings, generating EventID 4688 in the Windows Event log and EventID 1 in Sysmon. Let’s add those to our filter…
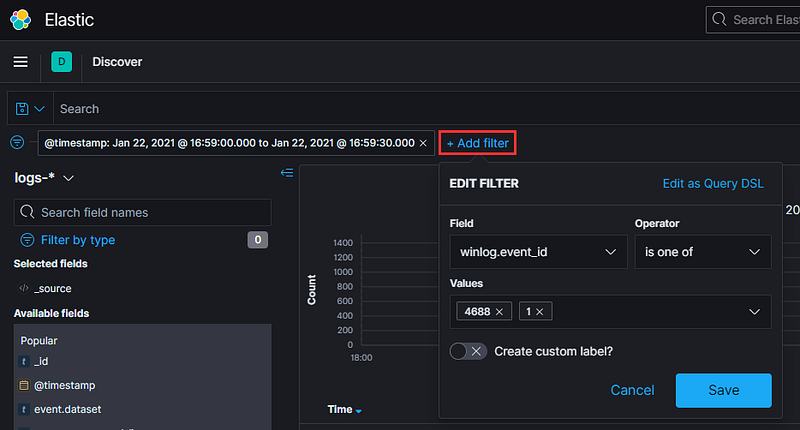
… and voilà! Much more manageable.
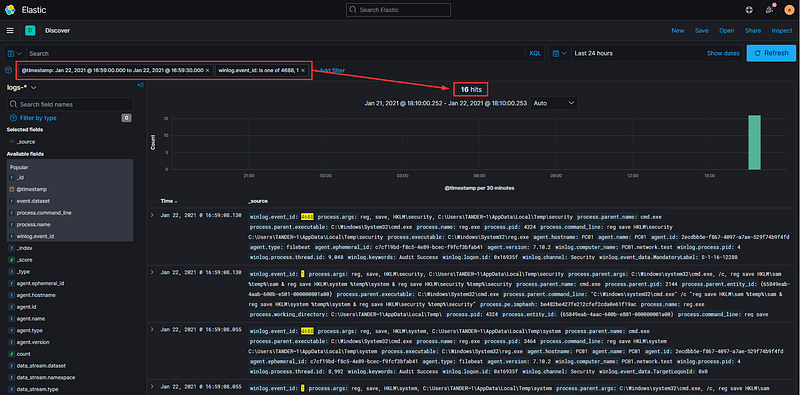
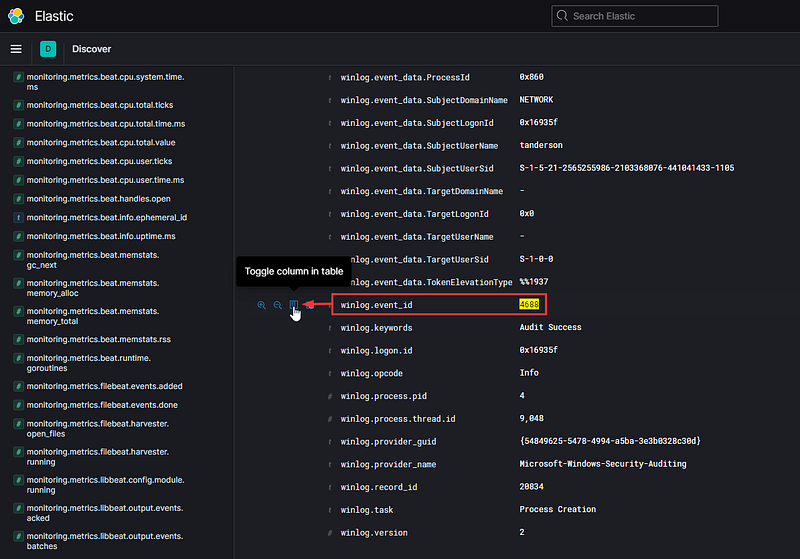
Sifting through sixteen log events is feasible, but we can enhance this process further. Expand one of the logs and scroll down to locate the 'winlog.event_id' field. Hover over it and select 'Toggle column in table.'
This action may not seem helpful at first, but let’s keep adding to our filters—this time, look for the ‘message’ field. This field contains the original log, but if you examine it closely, you will see each line has been separated into its own field. Look for ‘process.command_line’ and hover over it to toggle it as well.
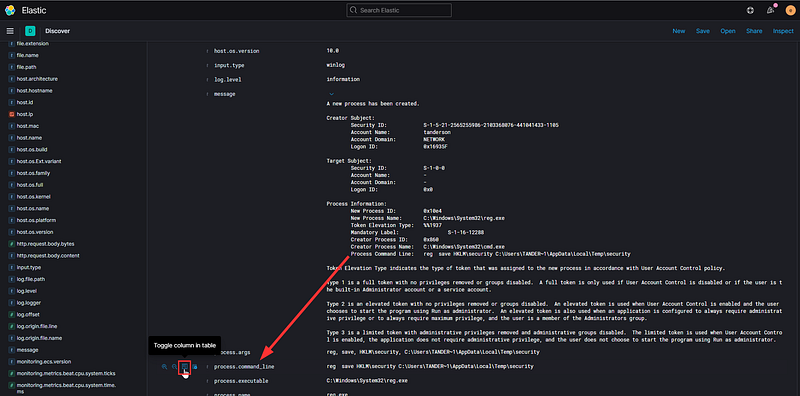
Initially, we faced a daunting wall of text with the challenge of filtering through thousands of logs to identify the specific event of interest. By leveraging what little information we had about the event, we were able to eliminate most irrelevant data, refining our search as we went. Now, as you scan from left to right, it’s much clearer to understand what occurred and when. You should notice two logs—one from Windows and one from Sysmon—that closely match the activities executed by our Atomic test.
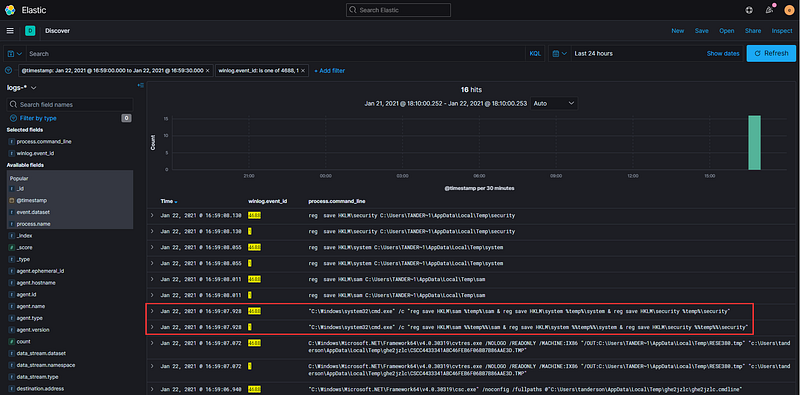
We have merely scratched the surface of what Elastic can offer regarding filtering and displaying data. Elasticsearch parses nearly every element of a log, separates each into distinct fields, and merges them into a searchable index. Combine this with Kibana’s data manipulation capabilities, and the possibilities for interpreting your data are nearly limitless. Take the time to explore and discover new ways to manipulate your data that may reveal fresh insights. One vital feature worth investigating is the Kibana Query Language.
Kibana Security Functionality
We have identified significant logs using the Discover functionality, but what about the Security section of Kibana we previously mentioned? I will share a useful trick to avoid starting your search over in another part of the application. Navigate to an interesting log you wish to investigate further, click on the exact timestamp, and filter for that value.
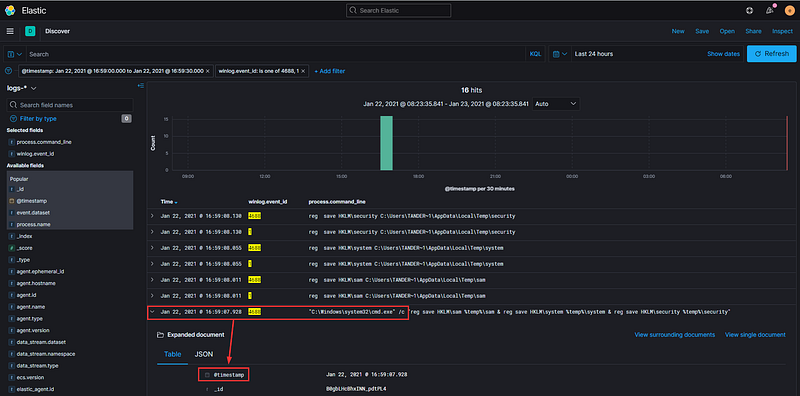
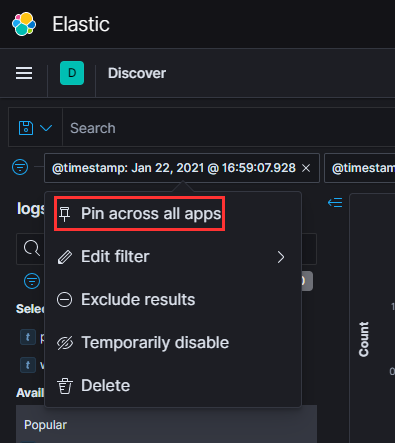
On the new filter you just selected, click ‘Pin across all apps’—you will notice a small gray rectangle appear in the leftmost part of the filter box.
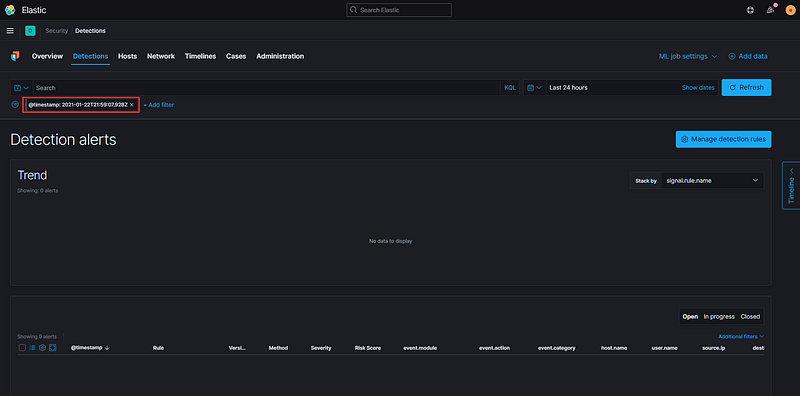
Now, proceed directly from Discover to the Detections tab in Security.
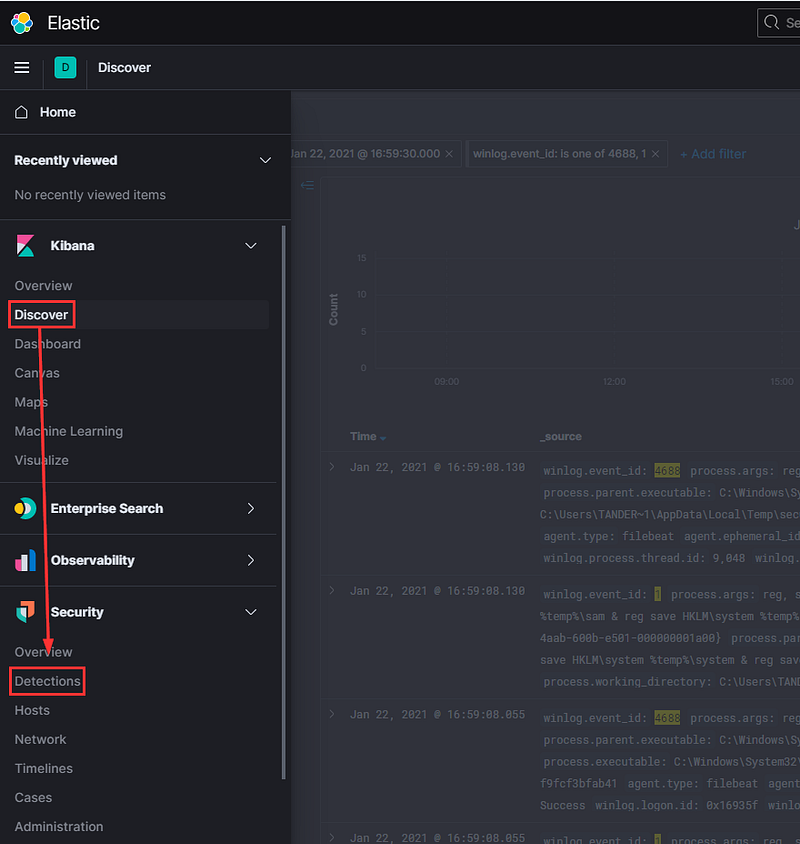
Initially, you might find nothing displayed here. This will be crucial later, but I wanted to highlight this aspect of the Security section before we continue. Additionally, observe that our timestamp filter has carried over from Discover to Security and will persist across all views until we remove it.
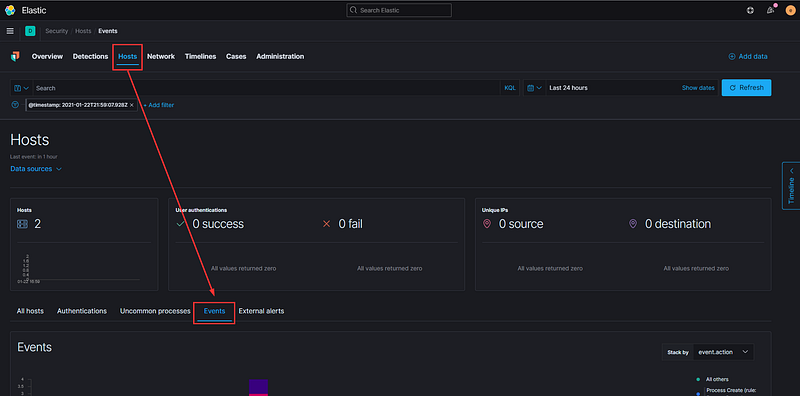
Click on the Hosts tab, then locate Events towards the middle of the screen.
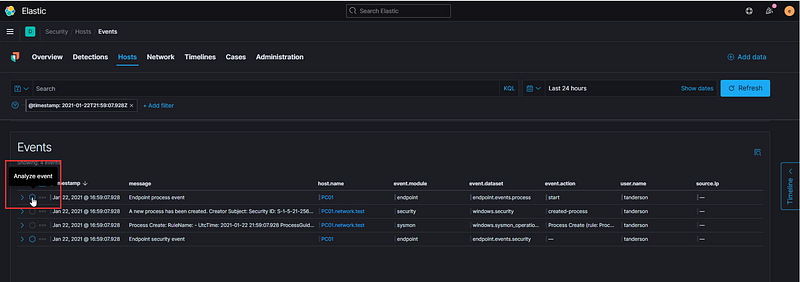
Scroll down slightly and you will see four events—two are the Windows and Sysmon logs, while the other two are event logs generated by the Elastic Agent itself. Let’s concentrate on the event labeled ‘Endpoint Process Event.’ Hover over the hexagonal icon that says ‘Analyze Event.’
This feature is known as the Visual Event Analyzer. According to the documentation, Elastic Security allows any event detected by Elastic Endpoint to be analyzed through a process-based visual analyzer. This facilitates security analysts in examining all related hosts, processes, and events to assist in their investigations.
Do you remember how our Atomic test extracted the Local SAM (SAM & System), cached credentials (System & Security), and LSA secrets (System & Security) from the registry and stored them in the temp folder?
This is how Elastic perceives that activity.
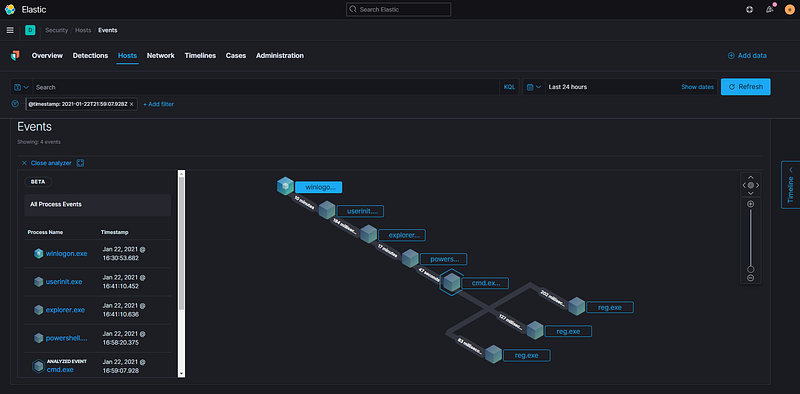
You can observe the chain of processes involved before PowerShell initiates and subsequent events that occur after executing the Atomic test. Clicking on any of the events will reveal additional details on the left side, including the process ID, user account, and full executable path.
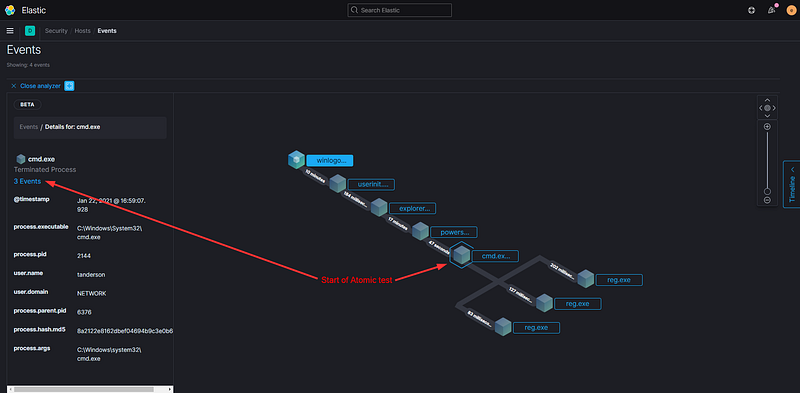
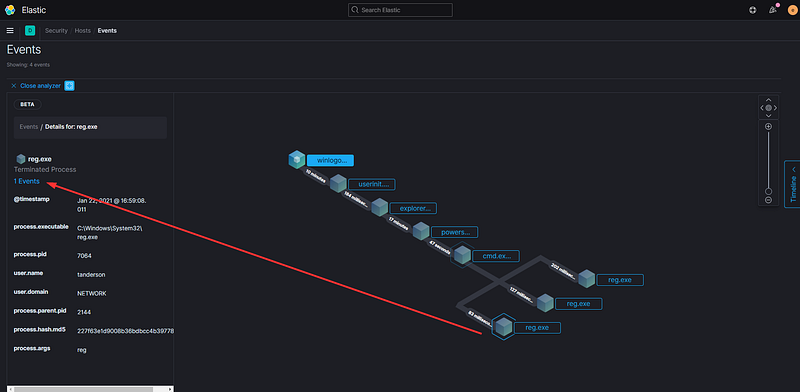
Despite this scenario being somewhat simplistic, I hope it has sparked your curiosity to correlate cause and effect and encourages you to conduct your own tests.
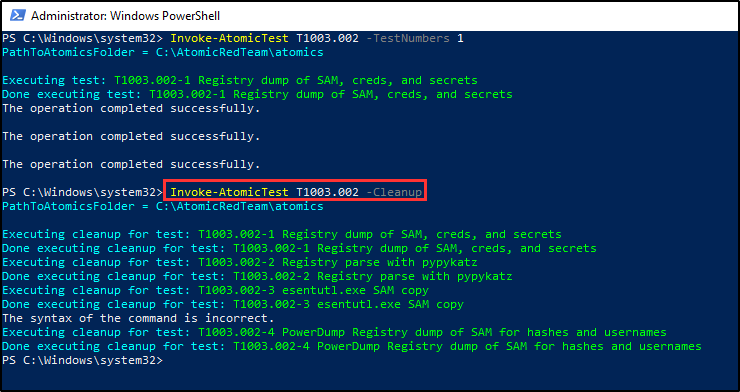
Before concluding this segment, let’s remember to clean up after ourselves on the target workstation.
Detection Mechanisms
While this exploration has been informative, we must consider how to detect these types of events when we lack knowledge about when or where they might occur. This is where detection rules become essential. Return to the Detections tab and select ‘Manage detection rules.’
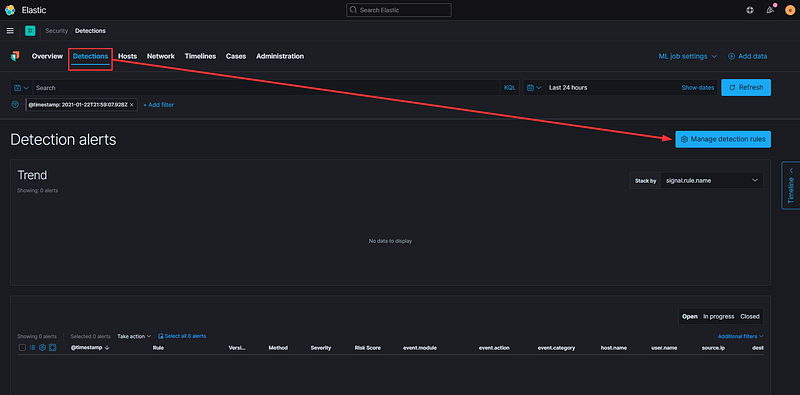
Before enabling every single rule, let’s take a moment to think strategically about the event we just explored. What were its defining characteristics?
- The “attack” utilized PowerShell
- PowerShell spawned several child processes, including cmd.exe
- The “attack” originated from tanderson’s user account
While we can create custom detections if needed, let’s first check if Elastic has pre-built rules that align with our requirements. A quick search for “powershell” reveals an existing detection specifically designed to identify command shells spawned from PowerShell.
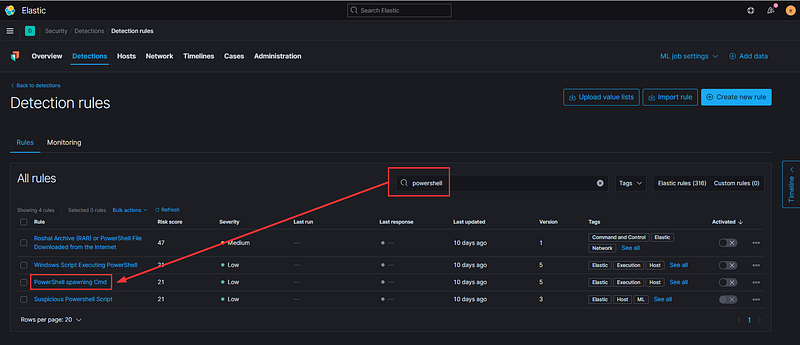
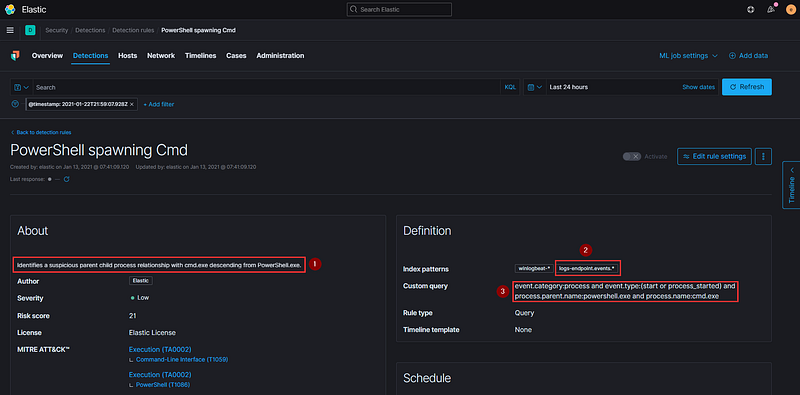
Observe that several details coincide with the event we investigated:
- Our test indeed spawned command shells that descended from PowerShell
- This detection examines the same indexes that contain our pertinent event
- The query specifically looks for powershell.exe as the parent and cmd.exe as the child
Let’s activate this detection. Optionally, we can duplicate it and incorporate specific usernames into the custom query—for instance, if tanderson works in accounting, he should not be executing PowerShell on his machine, which should trigger an alert. Conversely, Kyle, the sysadmin in IT, regularly uses PowerShell, so we should exclude his account from the custom query.
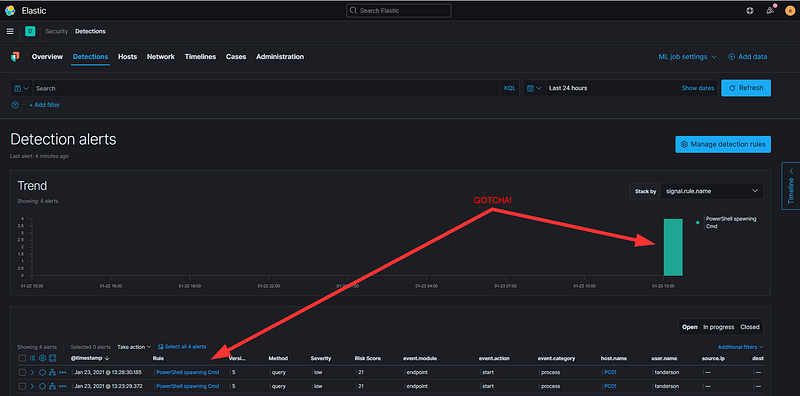
Run the test again on the target workstation and monitor for alerts (the detection defaults to triggering once every five minutes). Make sure to clear any filters, or else your results may be obscured!
Eventually, you should see your activity appear in the timeline. As a bonus, you can initiate investigations directly from the Detection tab without needing to return to the Hosts tab.
From here, the process involves testing, investigating, configuring detections, and repeating. You also have the option to set up detections to trigger email alerts or automated tickets that can be integrated into your company's alerting system (we all appreciate those 2 AM calls, right?).
